Liveness probe is a mechanism used by orchestrator platforms, to determine which process has gone faulty and then usually attempts to restart it, how is dependent on the orchestrator.
The faults are very much dependent on the process code, determining faults is dependent on both process code and the orchestration engine, handling the faults is usually left to the orchestration engine to handle it. So, it definitely sounds like a very useful feature then in the first glance for any orchestrator where a particular kind of process is running in a large number and for a very long time. But like any other feature it is easy to get it wrong and the effects can be mild to catastrophic when it can cause a complete Denial of Service (commonly reffered to as DoS). So, it’s not a silver bullet for all the applications, and there might be some applications which should never use it.
The rest of the post will talk only about k8s as the orchestration engine and the liveness probe it provides.
k8s crash course
The deployment unit in k8s is pods, which can compose multiple containers but usually one for the main process and the other side car containers for mutual TLS, or to decrypt some secrets. A pod has containers, each container is usually running one process. Kubernetes supports several container runtimes
, with Docker Engine still being the most popular one. Containers require memory and CPU for the processes to run and the liveness probes can be configured for each container as well inside the pod. These health checks are responsible for keeping your application up by replacing the seemingly unresponsive pods, mark them unhealthy and cause these pods to be restarted or rescheduled.
Health Checks
Health checks are configured in most processes to determine whether a process is responsive or not. This property is used by the probes in k8s. As of writing this, k8s only support HTTP endpoints for the liveness and readiness probe. Though there are other protocols as well which can be supported via HTTP proxies and sidecar containers can be injected in the pod for the similar reasons.
When should you not use liveness probe
The other way to think of this will be when would the liveness probe be not that useful or can bear catastrophic results.
Consider a single threaded process, where each thread processes one request it is getting and until that is completely processed no new process gets to be scheduled on the CPU, but it has a queue which can be used to manage multiple requests. The health check endpoint itself is very low, and returns 200 immediately. But it has to get to run on the CPU to return that. Now, let say the liveness probe is configured to hit every 10 seconds and can withstand a loss of 6 consecutive signals before the container/pod has to be deemed unhealthy, the timeout for the requests is 5 seconds let say. Now if you are just running one thread and it serves the requests as it comes, it only requires 6 requests coming at 10 seconds interval continuously each taking a second to timeout the health check endpoint and in turn to bring the pod down, with each request taking 6 seconds it just takes a request for each 10 seconds to turn the pod down.
If you have 20 of them running, it really just requires 20 such requests coming in at an interval of 10 seconds in the worst case(because of the k8s service load balancing the traffic to the pods), but 20 is an abysmal number and really if you have 1k rpm which is also low, there is a high probability all the pods are going to choke down at the same time after a long enough time, and making the entire system down with no scope of recovering with the high response time requests coming into the system steadily.
The only solution that can seem to work could be to increase the number of pods manually because the HPAs aren’t going to kick in because the pods are going down because of OOM killed etc. (most of the time), but with the kind of traffic it’s just a matter of time before the new pods aren’t able to live long enough either and scaling a lot of pods can have other catastrophic effects for a cluster running at capacity choking other services now. There is enough CPU if you just wait a little unlike memory where the overflow of it will crash the process while the kernel cleans it’s used memory, but the CPU wait is sometimes also an undesirable thing and therefore this scaling up the pods can be a bad mitigation strategy for-
- the cluster running at capacity
- doesn’t have nodes autoscaling enabled.
- have nodes autoscaling enabled. autoscaling isn’t free or rather cheap even, and it takes time to provision nodes and bring them into the cluster.
This also doesn’t take into account the backoff if you have configured any for the pod to come up(which is usually the case) and the effects will be even worse then.
Gunicorn and the queue up love story.
Disclaimer: I am no python or gunicorn expert, but the claims will be based on what I have managed to hookup quickly and have seen once in production for a large scale monolith. My domain is mostly compiled languages like-> go, rust having the runtime embedded into the ELF executable for the OS to run.
Python isn’t a single threaded language but it’s limited in concurrent programming because of the Global Interpreter Lock or GIL when the task is CPU intensive but that will largely be the case for most languages running on a single core and not utilizing multiple cores or hyper threaded threads for example.
Gunicorn is a wsgi python HTTP server for *nix. It’s a pre-fork worker model and the gunicorn process forks multiple processes at the time of startup to be able to serve requests better and not having to fork them at the time of request queuing. But it doesn’t eliminate request queueing entirely and it’s just n times better where n is the number of processes gunicorn forked while starting the application.
A quick example now.
We will create a new django project-> using django-admin startproject abcd. We won’t change most things in this, except ->
1update the settings.py's INSTALLED_APPS array to include the rest_framework.
and the urls.py should now look like->
 1from django.contrib import admin
 2from django.urls import path
 3from rest_framework.response import Response
 4from rest_framework.decorators import api_view
 5import time
 6
 7@api_view(('GET',))
 8def status(request):
 9    return Response({'status': 'ok'})
10
11@api_view(('GET',))
12def expensive(request):
13    time.sleep(10)
14    return Response({'status': 'ok'})
15
16
17urlpatterns = [
18    path('expensive',expensive),
19    path('status',status),
20    path('admin/', admin.site.urls),
21]
So now, we have an expensive handler and a healthcheck handler. So, now coming back to this, this healthcheck handler isn’t very useful but is unusually common in most deployments. This is just going to respond as long as the server process is running and there are other ways to ensure the process is running for example starting the process command can be part of dockerfile as it’s starting point, as soon as the process is down, the container goes down too, and the pods dies as well in favour of another pod to come up.
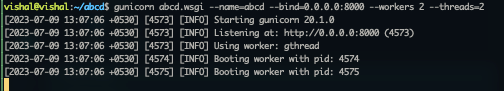
Now we will start the gunicorn server with 2 processes and 2 threads via->
1gunicorn abcd.wsgi --name=abcd --bind=0.0.0.0:8000 --workers 2 --threads=2
Now we hit the expensive one 4 times before hitting the healthcheck one by->
1for i in {1..4}; do; curl localhost:8000/expensive & ;printf "\n";done
then hitting the status endpoint took ~8 seconds, which confirms even if the request is idle and not doing anything on CPU or waiting on I/O the queued request won’t get a fair share of CPU to run.
1vishal% history -D | grep -i status | tail -n 1
2   11  0:08  curl localhost:8000/status
So, even though the process is running and just some requests are slow, the k8s would think the pod is unhealthy because the endpoint is timing out. So, even though the process is just degraded and would continue to serve the traffic at it’s capacity the healthcheck would just bring DoS.
The mitigation strategy would be use something like gevent worker class which can create low overhead light weight subroutines which can co-operatively be pre-empted when that subroutine goes into an I/O wait etc. Obviously this will be useful when the application is I/O intensive instead of CPU bound which is most often the case when choosing gunicorn to host the server otherwise there are definitely better alternatives and languages to do CPU bound work.
So, now we will launch our gunicorn server again with the gevent class and attack on it with vegeta .
1gunicorn abcd.wsgi --name=abcd --bind=0.0.0.0:8000 --workers 2 --worker-class=gevent --worker-connections=2000
2[2023-07-09 13:32:33 +0530] [5192] [INFO] Starting gunicorn 20.1.0
3[2023-07-09 13:32:33 +0530] [5192] [INFO] Listening at: http://0.0.0.0:8000 (5192)
4[2023-07-09 13:32:33 +0530] [5192] [INFO] Using worker: gevent
5[2023-07-09 13:32:33 +0530] [5193] [INFO] Booting worker with pid: 5193
6[2023-07-09 13:32:33 +0530] [5194] [INFO] Booting worker with pid: 5194
1./vegeta attack -rate 330 -duration 6s localhost:8000/expensive
Hitting at the rate of 330/sec for 6 seconds, and in another shell curl localhost:8000/status now returns immediately.
With this, obviously there was no cpu/memory spike noticed because the expensive endpoint itself is just expensive in terms of time and not in terms of CPU or memory. So, obviously htop -p $(pgrep gunicorn | paste -s -d, -) didn’t show anything, if your application is doing disk writes and flushes, please monitor iostat -x1 or similar metric exposing tools.
Liveness probe-> Synthetic Monitoring
Now about the liveness probe-> You might better off not using it in some places unless you are using it with caution. You can still have datadog monitors or setup New Relic synthetic monitoring which can tell you when it’s missing some heartbeats, the whole point of this simple status endpoint is to be able to tell you something’s wrong, not to make anything wrong. It can make things wrong to worse to DoS very quickly. So, let your observability tell you something’s wrong and you can take action which might include introducing a new Firewall rule for example, bringing the pod down will rarely be beneficial in this case unless it goes down because of the entrypoint process going down itself.
Comments